MuVis - Music Visualizer

Screenshots


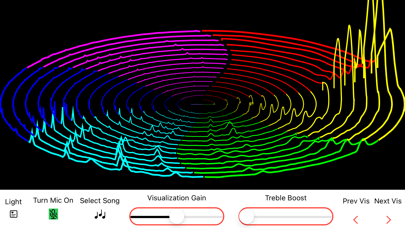
MuVis is an open-source macOS, iOS, and iPadOS app for music visualization. It renders informative (and musically useful) graphical displays in real time from music files being played - or from the device's microphone. Real-time music visualization is an exciting endeavor - providing the user with dynamic visual and aural stimulation and edification.
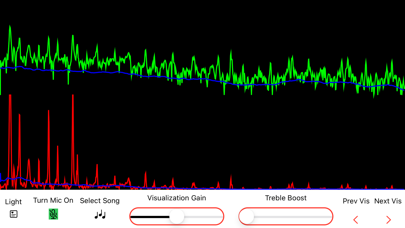
When the MuVis app first opens, the on-screen display should look somewhat like the first screenshot shown above and the computer's speakers should be playing music from a pre-loaded royalty-free music file. (Currently, the song file is "The Elevator Bossa Nova" from Bensound.com.) The on-screen display shows a real-time dynamic visual representation of the audio that you are hearing.
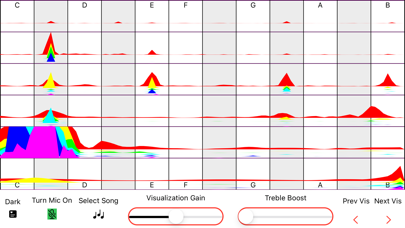
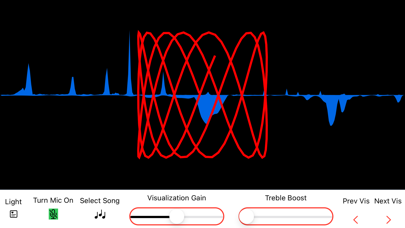
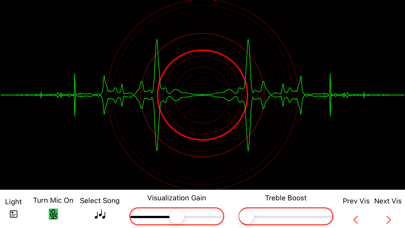
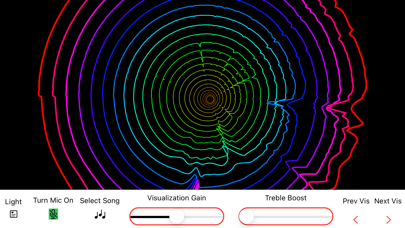
At the bottom left are two buttons labelled by left- and right-chevrons. Clicking the left one changes the display to the previous visualization, and clicking the right one changes the display to the next visualization - which allows you to cycle through the twenty-five visualizations currently provided by the app.
Adjacent to these chevrons is a button labelled “Pause”. When clicked, it stops the music playback and freezes the visualization display. The button label changes to “Resume” which, when clicked, causes the music playback and the visualization display to continue.
The adjacent button is labelled "Mic On". When pressed it stops playing the audio from the selected song file (and also stops it's visualization), and starts playing the live audio from the microphone (and starts it's visualization). The label then becomes "Mic Off" - which, when pressed, performs the reverse actions.
The next button is labelled "Song". It allows you to select whatever songs you want from your iCloud Drive folder. Selecting a song causes that song to play - and the visualization to render its dynamic attributes.
The adjacent button is labelled “Peaks”. When clicked, it passes the audio signal through a “spectral enhancer” filter which enhances the display of spectral lines (usually the harmonics of musical notes) and reduces the display of noise (usually percussive effects which smear spectral energy over a large range.) The label then becomes “Normal” which, when clicked, removes the enhancing filter.
The adjacent button is labelled “Option On”. When programming these visualization algorithms, there are numerous variations and options available. Rather than allowing just one variation, this button allows the user to select to see a second variation. (Perhaps a future release will allow multiple options.) The option rendered is different for each visualization.
The adjacent button is labelled “Dark”. When clicked, it toggles the app's window to Dark Mode. (Alternatively, if the window is currently in Dark Mode, the button label will be "Light" and when-clicked will toggle the window into Light Mode.)
Finally, at the right end of the bottom toolbar are two buttons labelled UserG (for User Guide) and VisG (for Visualization Guide). Clicking either button activates a “Quick Look” popup window to display the app's documentation.
The top toolbar contains two sliders - one controlling "Visualization Gain" and the other controlling "Visualization Treble Boost". As their names imply, sliding them adjusts the gain and slope of the visual data representation.
The source code for this app is posted at www.github.com/Keith-43/MuVis-v1.0
What’s New
Version 1.0.3 fixes a bug causing crash-on-launch with some iOS devices.
Version 1.0.3
Version History
App Privacy
The developer, Keith Bromley, has not provided details about its privacy practices and handling of data to Apple. For more information, see the developer’s privacy policy
No Details Provided
The developer will be required to provide privacy details when they submit their next app update.
Information
-
Category
-
Age Rating4+
-
PriceFree
-
Size23.62 MB
-
ProviderKeith Bromley
Languages
English
Copyright
©
2004-2026 Keith Bromley. All rights reserved.